Are you looking to create a Powerpoint for your company that contains an organizational chart but don’t know how to do it? Don’t worry, we’ll show you how to draw an organizational chart in Powerpoint very simply and quickly. Let’s take a look!
Nội dung
Simple instructions for drawing an organizational chart in Powerpoint
If you are having to insert each shape or line to create a link in your organization chart, stop right now. There is a simple way to create an organization chart with just one click. Here are the steps:
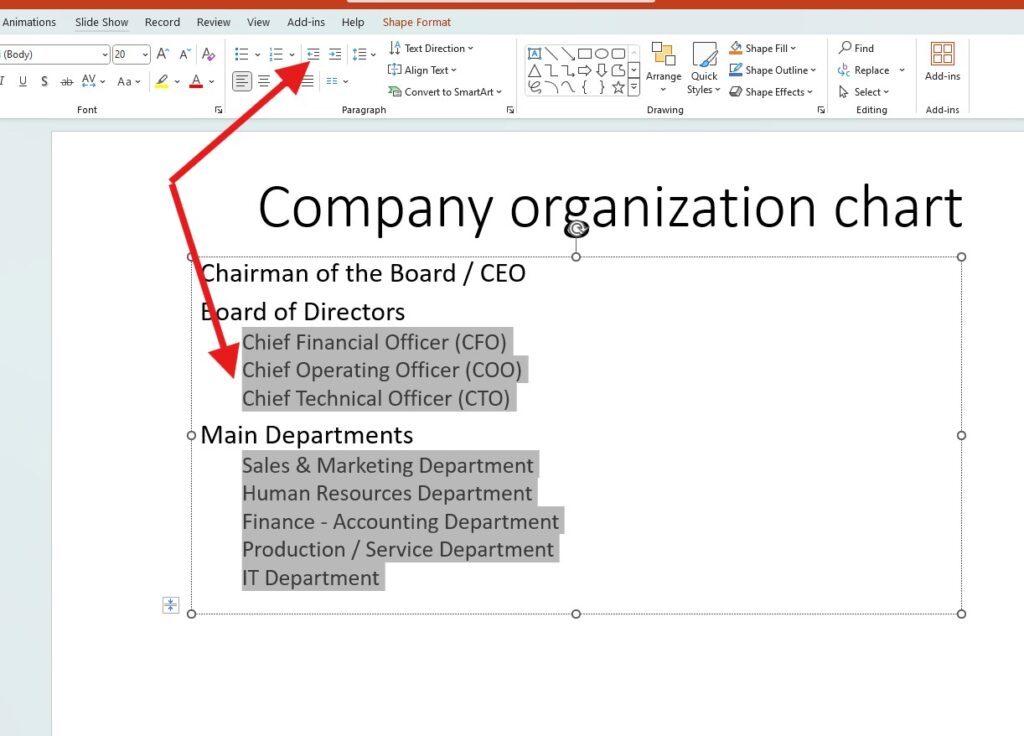
Step 1 : Open Powerpoint, go to the slide where you want to create an organization chart. Enter content into the cells:
Step 2 : You proceed to enter information about your organizational structure, the highest position will be at the beginning of the line, the next positions will be in descending order compared to the higher positions.

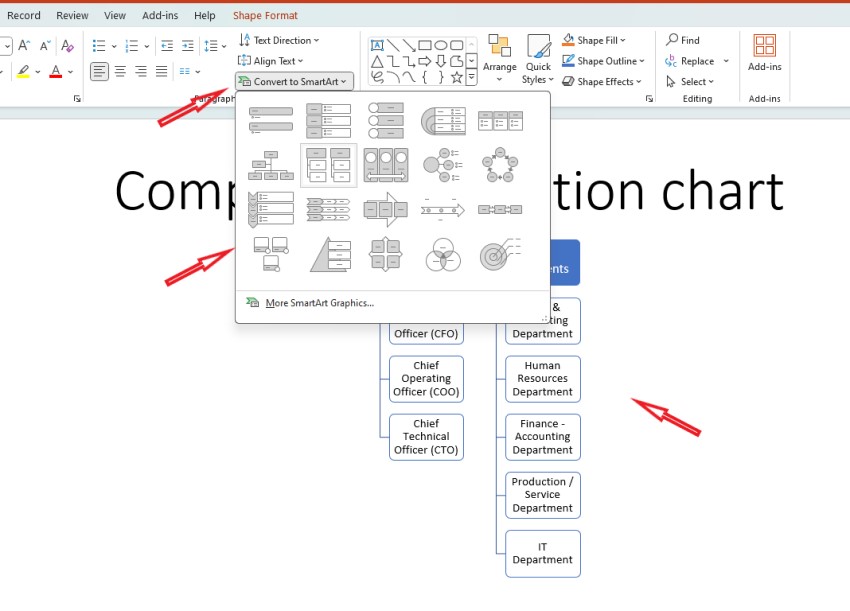
Step 4 : Select the Textbox where you just entered the organization’s positions, then go to the Home tab > select Convert to SmartArt .
You choose the chart type as Organizational chart , we get the extremely standard organizational chart below:

Step 5 : You can go to the Design tab to change other diagram templates as you like or Format to edit the format, font, shadow for shapes, or color to make your organization chart more attractive.
Create an organization chart with available templates in Powerpoint
Another way to draw an organizational chart is to use a template. You can quickly do this by following these steps:
Step 1 : Open Powerpoint application, go to File menu > select New > enter the keyword ” organizational chart ” in the search box. Powerpoint will suggest some available organizational chart templates for you, you can choose a suitable template to start editing.

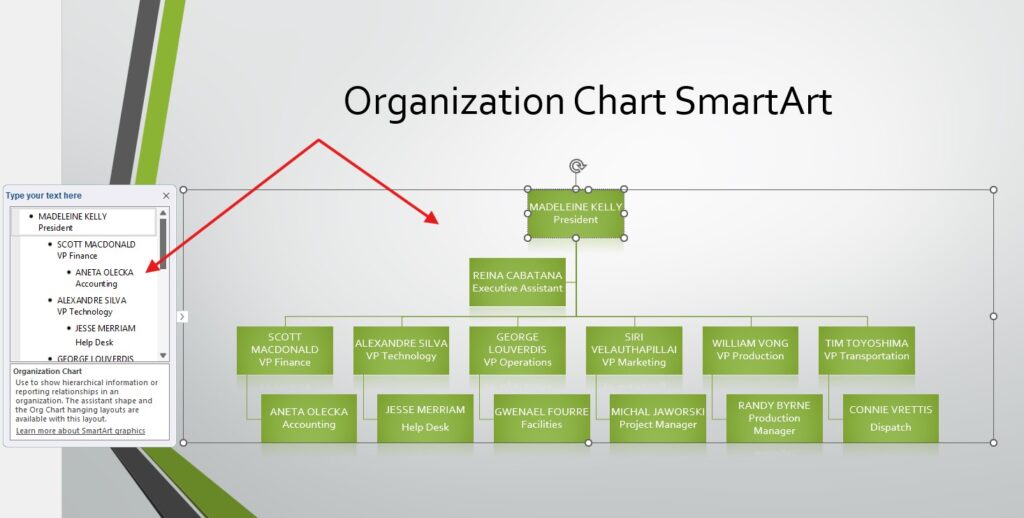
Step 2 : Click on the sample organizational chart, Powerpoint will now display a sub-panel Type your text here so you can edit the text in the template.

When selecting each position line in the sub-table, the corresponding diagram will also show which cell you are editing. You will look at it to proceed to enter replacement information in the sub-table.
If the sample chart has some extra position cells that are not correct for your organization, you can click on that cell in the chart, or the position row of that cell in the sub-table and press the Delete key .
Or if you want to add some positions to the diagram, you can add it in the sub-table. For example, I want to add the number of employees in the Marketing department, then in the position line at the same level as the employee, I will press Enter to go to the next line. So I have successfully added a position cell for the Marketing department!
Step 3 : Edit and format the diagram as desired. I usually use a template to avoid editing too much, so I will leave it as is. You can edit the colors or fonts to suit your business and organization better.
After completing the entire slide, don’t forget to add effects to make the organizational chart appear more impressive.
Above is a guide to drawing an organization chart in Powerpoint, extremely simple and fast. Hopefully, it will help your slide making process. Good luck!
See more: How to Create a Photo Album in PowerPoint (Step-by-Step Guide)
